Rounded top and bottom

The rounded top and bottom are reversal patterns designed to catch the end of a trend and signal a potential reversal point on a price chart.
The rounded top pattern appears as an inverted 'U' shape and is often referred to as an ‘inverse saucer’ in some technical analysis books. It signals the end of an uptrend and the possible start of a downtrend. This means that the rounded top can indicate an opportunity to go short.
The rounded bottom pattern appears as a clear 'U' formation on the price chart and is also referred to as a ‘saucer’. It signals the end of a downtrend and the possible start of an uptrend. This means that the rounded bottom can indicate an opportunity to go long.
How to identify a rounded top pattern
The chart below shows what a rounded top pattern looks like:

- Uptrend
- Rounded top
- Neckline
In order for the pattern to occur, the price must first rally upwards and consolidate for an extended period, forming the rounded top. It then eventually falls back down below the neckline of the consolidation area.
How to trade the rounded top
To trade this pattern look for the neckline that is marked on the chart below. Once the price breaks through and a candle closes below the neckline, you can enter the market with a sell order.
The chart below shows the neckline being broken by the price – this is where short traders can enter the market.

- Uptrend
- Rounded top
- Neckline
- Close of candle that breaks the neckline
- Short entry
The stop loss is placed above the neckline of the pattern. If the price trades beyond this point, the probabilities of the pattern working out have decreased and you do not want to be in the market any longer.
The profit target is measured by taking the height of the actual pattern and extending that distance down from the neckline.
The chart below demonstrates the stop loss and take profit levels:

- Uptrend
- Rounded top
- Neckline
- Height of pattern
- Same distance away from neckline as 4
- Short entry
- Stop loss
- Take profit
How to identify a rounded bottom pattern
The chart below shows what a rounded bottom pattern looks like:
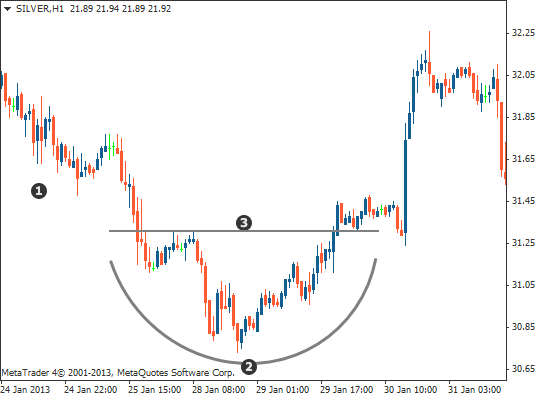
- Downtrend
- Rounded bottom
- Neckline
This pattern also requires a sustained price move, this time to the downside before consolidating for an extended period and forming the rounded bottom. The price then begins to rally back above the neckline of the consolidation area. At this point the pattern has been completed.
How to trade the rounded bottom
We will now look at how to trade the rounded bottom pattern.
Enter the trade
To trade this pattern look for the neckline that is marked on the chart below. Once the price breaks through and a candle closes above the neckline, you can then enter the market with a buy order.
The chart below shows the neckline being broken by the price – this is where long traders can enter the market.

- Downtrend
- Rounded bottom
- Neckline
- Close of candle that breaks the neckline
- Long entry
The stop loss is placed below the neckline of the pattern. If the price trades below this point, the probabilities of the pattern working out have decreased and you do not want to be in the market any longer.
The profit target is measured by taking the height of the actual pattern and extending that distance up from the neckline.
The chart below demonstrates the stop loss and take profit level:

- Downtrend
- Rounded bottom
- Neckline
- Height of pattern
- Same distance away from neckline as 4
- Long entry
- Stop loss
- Take profit
Summary:
In this lesson, you have learned that:
- … the rounded top is a reversal pattern designed to identify the end of an uptrend and the beginning of a potential downtrend. It has the appearance of an inverted 'U' shape on the price chart.
- … the rounded bottom is a reversal pattern designed to identify the end of a downtrend and the beginning of a potential uptrend. It has the appearance of a 'U' shape on the price chart.
- … both patterns consist of an initial move in one direction, followed by consolidation or price rounding; then a breakout of the neckline in the opposite direction to that of the first move.
- … traders would only look to enter the market when the neckline of the pattern is broken. Look for candle closes above (for rounded bottom) or below (for rounded top) the neckline to confirm this.
- … the stop loss can be placed above the neckline when trading the rounded top and below the neckline when trading the rounded bottom.
- … the profit target is measured by taking the height of the actual pattern and extending that distance from the break of the neckline.


