Finding entries at support or resistance
Now that you have placed your support and resistance levels, you can now look for possible entries at the support or resistance levels.
Enter trades at support and resistance
Look at the price chart and observe the support and resistance levels that you have drawn on the charts. You will look to place sell orders at the resistance levels and buy orders at the support levels.
Selling at the resistance levels
Take a look at the following chart – you can see a number of support and resistance levels:
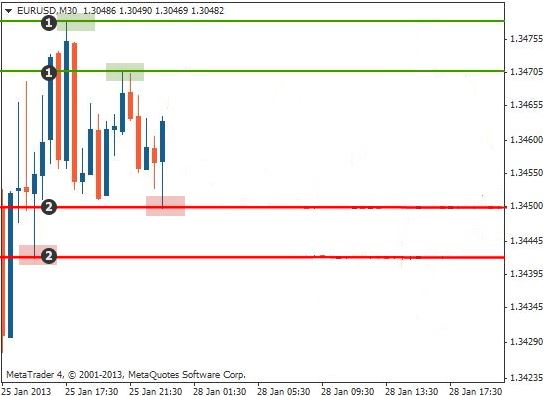
- Resistance levels
- Support levels
The green shaded areas show where the price found resistance and the red shaded areas show where the price found support.
The next step is to wait until the price meets one of these support or resistance levels.
In the following chart, you can see where the price has moved up to resistance and has not managed to break above it:

- Resistance levels
- Shaded shows that the price has found resistance at this level.
Now enter a short (sell) trade after the candle has closed:

- Resistance levels
- Short entry
Place your stop loss on the other side of the resistance level:

- Resistance levels
- Short entry
- Stop loss
In order to place your profit target, find the next support level down and place your profit target there:

- Resistance levels
- Short entry
- Stoploss
- Next support level down
- Profit target
You should make sure that your reward is bigger than your risk. It is up to you what your optimal risk to reward should be – ideally you should have a risk to reward of 1:2 or 1:3.
Buying at support levels
We will now show you an example of buying at support. The following chart shows a number of support and resistance levels:

- Resistance levels
- Support levels
The next step is to wait until the price meets a support level. In the following chart you can see where the price has come back down to a support level. You can then enter a long trade:

- Resistance levels
- Support levels
- Long entry at the support level
The stop loss goes just below the support level:

- Resistance level
- Support level
- Long entry at the support level
- Stop loss below the support line
The profit target goes at the next resistance level up:

- Resistance levels
- Support level
- Long entry after support held
- Stop loss below the support level
- Take profit at the next resistance level.
You should make sure that your reward is bigger than your risk. It is up to you what your optimal risk to reward should be – ideally you should have a risk to reward of 1:2 or 1:3.
You can go on to learn the second method of trading with support and resistance.


