Fractals indicator
Fractals are indicators on candlestick charts that identify reversal points in the market. Traders often use fractals to get an idea about the direction in which the price will develop. A fractal will form when a particular price pattern happens on a chart.
The pattern itself comprises five candles and the pattern indicates where the price has struggled to go higher, in which case an up fractal appears or lower, in which case a down fractal appears.
The chart below shows what fractal indicators look like on a chart:

Formation of an up fractal
An up fractal formed when a candle has two candles to the right of it with two lower highs and at least two candles to the left of it with two further lower highs.
The following chart shows what this pattern looks like:
- Two candles marking lower highs to the left
- The fractal over the higher high
- Two candles marking lower highs to the right
A down fractal is formed when a candle has two candles to the right with higher lows and two candles to left with two further higher lows.
The following chart shows what this pattern looks like:
- Two candles marking higher lows to the left
- The fractal under the lower low
- Two candles marking higher lows to the right
The fifth candle must close
Since a fractal is a five-candle pattern, the fifth candle in the set must close and complete before any trading decisions can be based on that particular fractal.
This is because the price can move during the time that the fifth candle is forming. If price moves either above the higher high or below the lower low, while the pattern is still forming, the fractal indicator will disappear from your price chart. So you must wait for the pattern to complete in order to make sure that the fractal is confirmed.
Fractal indicators can be used to determine the market direction
Traders can use fractal indicators to determine the possible direction of price in a market.
One way in which traders do this, is by looking for broken fractals. A fractal is considered broken when a fractal has been confirmed and then the price breaks through either the high or the low of the pattern. If the price breaks an up fractal then the direction of the market is considered up and if the price breaks a down fractal then the market is considered down.
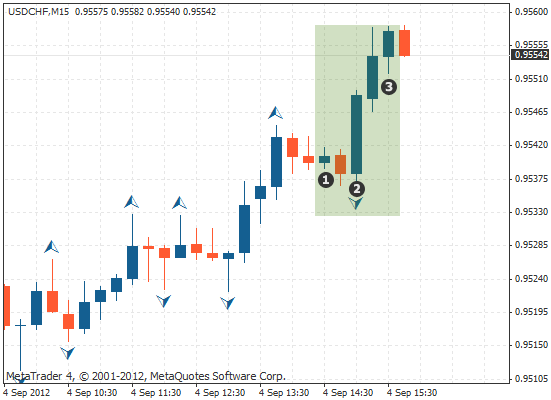
The image below demonstrates how this appears on a chart when the price has broken the most recent down fractal.

- The fractal low candle
- Two candles marking higher lows to the right
- Candle breaking the low of the fractal candle (1)
As you can see in the chart above, the last fractal to be broken was a down fractal. This suggests the market is bearish, meaning traders should be looking for selling opportunities.
The next example shows when the price has broken an up fractal:

- The fractal high candle
- Two candles marking lower highs to the right
- Candle breaking the high of the fractal candle (1)
The chart above demonstrates that the most recent up fractal was broken. This suggests the market is bullish, meaning traders should be looking for buying opportunities.
Fractals tend to be more reliable indicators of direction when used with longer time frames than with shorter time frames.
Using fractals for stop loss placement
Traders also often use fractals to decide where to place stop-loss orders.
For example, when entering a short position you can use the most recent up fractal to place your stop loss.
Traders usually use the tip of the actual fractals indicator for this, rather than the candle itself, as shown on the chart below:

- Stop placed at the tip of the fractal
As you can see above, despite the fact that there are many up fractals on the chart, the most recent one is used to place the stop loss.
When entering a long position you can use the most recent down fractal to place your stop-loss order, as shown on the chart below:

- Stop loss placed at the tip of the fractal
You can see how it is the most recent down fractal that is used to place the stop loss.
Summary
In this lesson, you have learned ...
- ... a fractal is an indicator that shows a potential reversal point in the markets.
- ... they form when a particular price action happens on a chart.
- ... the pattern is composed of five candlesticks.
- ... an up fractal forms over a candle that has two candles to the left and the right with lower highs.
- ... a down fractal forms under candles with two candles to the left and the right that have high lows.
- ... fractal indicators can be used to determine the direction of the market when the price breaks through the highest high or the lowest low of the pattern.
- ... fractals can be used to place stop losses.


