Bullish rectangle
Rectangles are continuation patterns that occur when a price pauses during a strong trend and temporarily bounces between two parallel levels before the trend continues.
As with many chart patterns, there is a bullish and bearish version.
In this lesson, we will show you how to identify the bullish rectangle and use it as a possible buying opportunity.

How to identify the bullish rectangle
Bullish rectangles are easier to identify than some other patterns such as pennants.
See the price chart below for an example of what a bullish rectangle looks like:
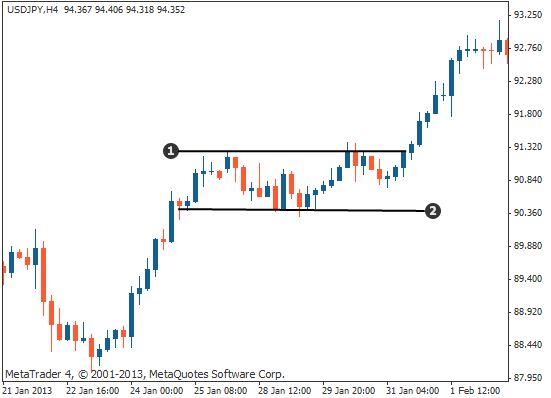
- Resistance line
- Support line
As shown above, the price rises in a strong uptrend and then starts to consolidate between temporary support and resistance levels.
It continues to move sideways, bouncing between these two parallel lines and forming a box-like shape that gives the pattern its name.
The price then breaks out above the upper resistance level and continues its uptrend.
How to trade the bullish rectangle: method 1
We will now show you two methods to trade the bullish rectangle pattern.
Enter your trade
As soon as a candlestick has closed above the rectangle's upper parallel line (the resistance level), enter your trade with a long (buy) order.
See the chart below for an example of this:

- Resistance line
- Support line
- Area where price has broken through resistance 1
- Buy order (long entry)
Place your stop loss
Place your stop loss just underneath the rectangle's lower parallel line (the support level).
See the chart below for an example of this:

- Resistance line
- Support line
- Area where price has broken through resistance 1
- Buy order (long entry)
- Stop loss
Place your profit target
Measure the height of the rectangle and then place your profit target the same distance above the top of its upper parallel line.
See the chart below for an example of this:

- Resistance line
- Support line
- Area where price has broken through resistance 1
- Buy order (long entry)
- Stop loss
- Take profit
How to trade the bullish rectangle: method 2
The following is the second method to trading the bullish rectangle.
Enter your trade
As with method 1, wait for a candlestick to close above the upper parallel line, breaking the rectangle's resistance.
Then, wait for the price to retest the upper line – this broken resistance level now turns into a support – and place your buy order.
See the chart below for an example of this:

- Resistance turned support
- Support
- Buy order (long entry)
Place your stop loss
Place your stop loss just underneath the rectangle's upper parallel line (the old resistance level that has now turned into a support)
See the chart below for an example of this:

- Resistance turned support
- Support
- Buy order (long entry)
- Stop loss
Place your profit target
As with method 1, measure the height of the rectangle and then place your profit target the same distance above the top of its upper parallel line.
See the chart below for an example of this:

- Resistance turned support
- Support
- Buy order (long entry)
- Stop loss
- Take profit
Summary
In this lesson, you have learned that ...
- ... bullish rectangles are continuation patterns that occur when a price pauses temporarily during an uptrend – they offer you a buying opportunity.
- ... you enter your long trade after the rectangle's upper resistance level has been broken or, in the case of method 2, after it has been broken and then retested.
- ... you place your stop loss below the rectangle's lower support line or, in the case of method 2, under the higher parallel line once it has turned into a support.
- ... you place your profit target the same distance above the rectangle's upper resistance level as the distance between the rectangle's two parallel lines.


