Cup and handle

The cup and handle is a bullish continuation pattern used to find buying opportunities in the market.
It is used to identify the continuation of an uptrend in price and is so named because the pattern resembles the appearance of a cup and handle.
How to identify a cup and handle pattern
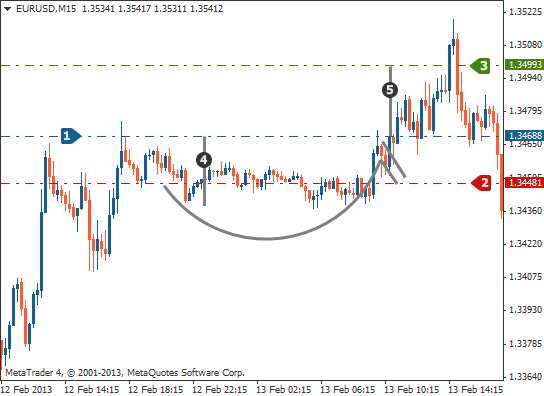
The chart below shows what this pattern looks like:

- Initial move upwards
- Cup
- Handle
- Continuation of move upwards
As you can see, the pattern is formed after the price moves sharply in an upwards direction, after which the market begins to sell off and the price retraces slightly, helping to form the ‘cup’ section of the pattern. This gives a 'rounded bottom' appearance, similar to that of a bowl.
As the price continues on up, it retraces once again, this time more gradually, forming the 'handle' section of the pattern. Finally, it then makes a continuation move upwards beyond the initial high of the first move.
The cup section of the pattern should be around a third to two thirds the size of the initial move up (in terms of height) so as to ensure a reliable pattern.
An ideal cup
The chart below shows an ideal 'cup':

- Initial move upwards
- Cup
- Handle
- Continuation of move upwards
As you can see, the cup is just under two thirds the height of the first move up, and shows rounded price action, rather than a sharp pullback.
An ideal handle
The handle is also a very important component of the pattern, as this completes it and gives traders clues about when would be best to enter the trade.
The retracement forming the handle should not exceed the move up on the right hand side of the cup. Traders often use a trend line to measure the downward move of the handle.
The chart below shows an ideal handle section of the pattern:

- Cup
- Upward move
- Handle
How to trade the cup and handle pattern
To trade this pattern look for the handle of the pattern that is marked on the chart below. Once the price breaks above the upper trend line of the handle and a candle closes above the trend line, you can enter the market with a long order.
The chart below shows the handle being broken by the price – this is where traders can enter the market:

- Upper trend line of handle
- Long entry
A stop loss can be placed below the low of the 'handle' of the pattern. If the price trades beyond this point, the probabilities of the pattern working out have decreased and you do not want to be in the market any longer.
The take profit objective when trading these patterns is very simply measured by taking the bottom of the cup to the breakout point and extending this upwards.
The chart below demonstrates the stop loss and take profit levels:
- Long entry
- Stop loss
- Take profit
- Distance from base of the cup to the breakout point
- Same as distance 4
Summary
In this lesson, you have learned that:
- … the cup and handle is a bullish continuation pattern used to find buying opportunities in the market.
- … the pattern is composed of two sections; the cup and the handle.
- … the cup should be rounded and just under two thirds the height of the initial move.
- … the handle should not pull back more than the right side of the cup and traders can enter on a trend line break of the handle.
- … the stop loss can be placed below the low of the handle of the pattern.
- … the take profit is measured using the base of the cup to the breakout point and extending this measurement above the breakout to the upside.


