Rising wedge
The wedge pattern can be used as either a continuation or reversal pattern, depending on where it is found on a price chart. There are two types of wedge pattern: the rising (or ascending) wedge and the falling (or descending wedge).
This lesson shows you how to identify the rising wedge pattern and how you can use it to look for possible selling opportunities.

Identifying the rising wedge pattern in an uptrend
A rising wedge in an uptrend is considered a reversal pattern that occurs when the price is making higher highs and higher lows. As the chart below shows, this is identified by a contracting range in prices. The price is confined within two lines which get closer together to create a pattern. This indicates a slowing of momentum and it usually precedes a reversal to the downside. This means that you can look for potential selling opportunities.

Identifying the rising wedge pattern in an downtrend
A rising wedge in a downtrend is a temporary price movement in the opposite direction (market retracement). As in the case of a rising wedge in a uptrend, it is characterised by shrinking prices that are confined within two lines coming together to form a pattern. It indicates the continuation of the downtrend and, again, this means that you can look for potential selling opportunities.
The charts below show an example of a rising wedge pattern in a downtrend:

Trading the rising wedge: method one
Once you have identified the rising wedge (whether in a uptrend or downtrend), one method you can use to enter the market with is to place a sell order (short entry) on the break of the bottom side of the wedge. In order to avoid false breakouts, you should wait for a candle to close below the bottom trend line before entering.
The chart below demonstrates the area where price breaks the lower support trend line and where you should place the sell order:

- Area where price has broken the lower support trend line
- Sell order (short entry)
The chart below shows where you should place the stop loss. This is placed above the top side of the rising wedge.

- Area where price has broken the lower support trend line
- Sell order (short entry)
- Stop loss
Finally, the last chart shows the profit target. This is measured by taking the height of the back of the wedge and by extending that distance down from the trend line breakout.
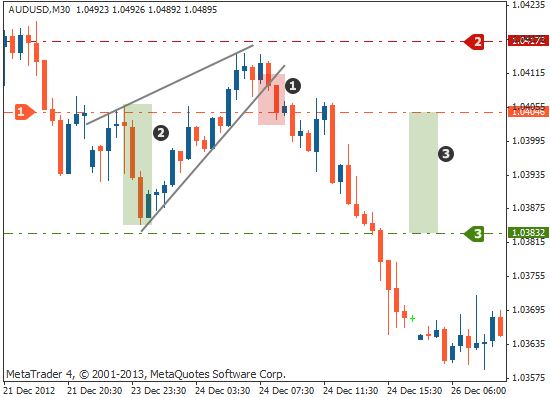
- Area where price has broken the lower support trend line
- Back of the wedge
- Distance between entry (sell order) 1 and take profit 3 (this is the same height as the back of the wedge 2)
- Sell order (short entry)
- Stop loss
- Take profit
Trading the rising wedge: method two
The second way to trade the rising wedge is to wait for the price to trade below the trend line (broken support), as in the first example. Then, you should place a sell order on the retest of the trend line (broken support now becomes resistance).
The chart below shows how to place the sell order:

- Point at which the price finds resistance at the lower part of the wedge.
- Short entry
The stop loss would go above the new resistance area, as shown by the following chart:

- Point at which the price finds resistance at the lower part of the wedge.
- Back of the wedge
- Distance between entry (sell order) 1 and take profit 3, same height as back of wedge 2
- Sell order (short entry)
- Stop loss
- Take profit
Summary
- … the rising wedge pattern signals a possible selling opportunity either after an uptrend or during an existing downtrend.
- … the entry (sell order) is placed either when the price breaks below the bottom side of the wedge or the price finds resistance at the lower trend line.
- … you can place the stop loss above the back of the wedge.
- … the take profit target is measured by taking the height of the back of the wedge and by extending that distance down from the entry.


