Aligning higher time frames for trading
One of the main concepts behind the beginner strategy is multiple time frame analysis – using a higher time frame to determine the overall market direction and executing trades on a lower time frame.
By determining the overall direction on a higher time frame and trading in that direction, you make sure that you trade in the direction of the overall trend – this increases your chances of profitable trades. In the beginner strategy, you use the 30 minute chart as the higher time frame, however, you can go a step further and also use the 4 hour time frame to assess an even larger picture.
You can use two higher time frames to filter trades
To do this, you use the 4 hour chart in conjunction with the 30 minute time frame. If the 30 minute time frame and the 4 hour time frame are aligned, indicating the same market direction on both time frames, then you can take trades in that direction.
For example, if the direction on the 4 hour and the 30 minute chart is up, then you could look for long trades. Similarly, if the direction on the 4 hour and 30 minute chart is down, then you can look for short trades.
If the 4 hour chart conflicts with the 30 minute chart, showing two different directions, then you can stay out of the market until they align again.
How to determine if the 4 hour and 30 minute time frames agree
The following shows how to determine if the 4 hour chart and the 30 minute chart show the same market direction.
To align two higher time frames, you start at the highest time frame and then work down. So first switch to the 4 hour time frame and use the same rules as determining the market direction on the 30 minute chart.
You look for the last break of an up fractal and the last break of a down fractal. If the last fractal break was of an up fractal, then the direction is up on the 4 hour chart. Similarly, if the last break was of a down fractal, then the market direction is down on the 4 hour chart.
You can see this demonstrated on the chart below. The last break of a fractal was an up fractal and so the direction on the four hour chart is up.
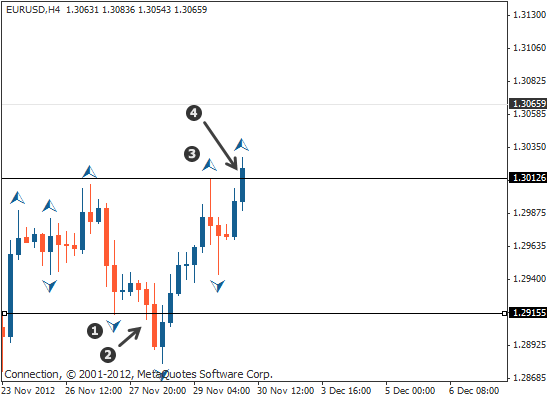
- Last down fractal to be broken
- Last break of the down fractal
- Last up fractal to be broken
- Break of the last up fractal. This is the last break to happen and so the direction on the four hour chart is up
Then go to the 30 minute chart and check the market direction to make sure that they are in alignment with each other. Find the last break of an up fractal and then the last break of a down fractal. Whichever broke last determines the direction.

- Line drawn on the 4 hour chart
- Line drawn at the last fractal that was broken – this was an up fractal
- Break of the last fractal which was an up fractal, indicating that the market direction is up.
The 4 hour time frame and the 30 minute time frame are aligned in the same direction, which means that you could now use this to look for buying opportunities.
If the 4 hour and the 30 minute chart have both shown to have a market direction to the downside, then you would look for short trades on the lower time frame. If the 4 hour and 30 minute chart were not in alignment, then you would simply wait until they are – either both showing that the market direction is up or that the market direction is down before you start looking for trades.
Summary
So far your have learned:
- the beginner strategy uses multiple time frame analysis to determine the overall trend direction, so you can trade in the direction of the trend.
- trading higher time frames will help make sure you incorporate an even longer term trend.
- you can wait until the 4 hour chart and the 30 minute chart are aligned, indicating the same direction, in which you can then trade in that direction.
- you start with the 4 hour chart, determine the direction and go down to the 30 minute chart and check that the 30 minute chart is indicating the same direction.
- if the 4 hour and the 30 minute chart are not aligned, then this acts as a filter and you can stay out of the market until they are.


