Trend lines
Trend lines are lines drawn at an angle above or below the price. They are used to give indications as to the immediate trend and indicate when a trend has changed. They can also be used as support and resistance and provide opportunities to open and close positions.

Drawing trend lines
The chart below shows an example of a trend line in a downtrend and an uptrend.

- Shows three swing highs on the downtrend
- Shows three swing lows on the uptrend
When drawing trend lines in a downtrend, you draw them above the price.
When you draw trend lines in an uptrend, you draw them below the price. It is the highs on a downtrend and the lows on an uptrend that will determine a trend line.
At least two swing highs or swing lows are needed to draw a trend line in either direction.
However, for a trend line to be valid, at least three highs or lows should be used. Essentially, the more times the price touches a trend line, the more valid it is, because there are more traders using them as support or resistance.
Using the wicks or bodies of the candles
To draw trend lines, some traders use the bodies of the candlesticks, while others prefer the wicks. While the majority of people will use the wicks to draw trend lines, the use of the bodies is an acceptable way to draw trend lines on a chart.
The chart below shows a trend line drawn using the wicks of the candlestick.

The next chart below shows a trend line drawn using the bodies of the candles. Either of these are acceptable.

Trend lines are subjective, so use what you feel comfortable with. However, it is important not to deviate from the method that you choose.
Using trend lines to trade
There are two predominant methods in which to trade using trend lines:
- Entering when the price finds support or resistance at the trend line
- Entering when the price breaks through the trend line
Trend line as support or resistance
If a trend line has been identified and it is holding as support or resistance, then you can use the trend line to enter into the market once the price comes back to it.

- Short entry after the price finds resistance at the trend line
- Stop loss above the trend line
The chart above shows the trend line being used as resistance and the price using it to find an entry.
A stop loss can be put on the other side of the trend line. The size of the stop loss depends on the strategy involved.
Trend line break
The trend line break method uses the actual breakout of the line to determine an entry. When the price breaks through a trend line, it is no longer valid as support or resistance and it is likely that the price will continue to reverse direction.
There are two ways to enter using a trend line break: an aggressive entry and a conservative entry.
An aggressive entry
An aggressive way to enter using a trend line break is to enter as soon as the candle breaks through and closes on the other side of the trend line.
- Short entry after the price broke through the trend line to the downside
- Stop loss is placed above the trend line
The chart above demonstrates that once the candle closes on the other side of the trend line, then you can enter immediately. A stop loss can be placed on the other side of the trend line.
A conservative entry
A more conservative way of trading the trend line break is to wait until the price has broken through the trend line and then tested from the other side as either support or resistance.
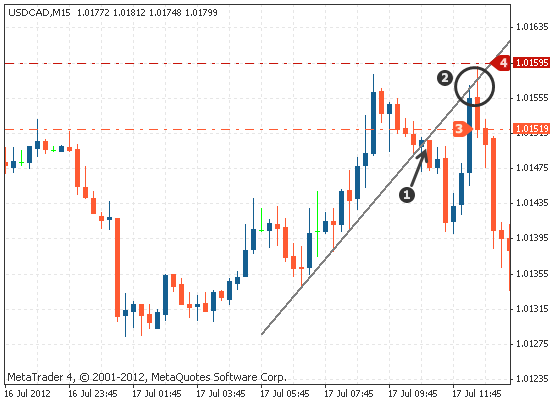
- Price breaks through the trend line to the downside
- Wait for the price to come back to the trend line and find resistance
- Once determined that the breakout is true, enter into a short entry
- Stop loss is placed above the trend line
The chart above shows a trend line that has been broken after acting as support. The price then tested it from the other side as resistance, further confirming that the breakout is likely to continue. After the trend line has been tested as resistance, you can enter a short position and place a stop loss on the other side of the trend line.
Caution using trend line breaks
In order to trade a breakout of a trend line, it is a good idea to wait until a candlestick actually closes on the other side, or tests the other side of the trend line as either support or resistance. Without a close on the other side of the trend line, it is generally not considered an actual break.

- False breakout
In the above chart, the price moved below the trend line. However, it retraced and the candlestick closed above the trend line. If a trader entered as soon as the price broke through, it would have been a losing trade.
Summary
So far, you have learned that:
- trend lines are drawn at an angle and are used to determine a trend and help make trading decisions.
- in an uptrend, trend lines are drawn below the price and in a downtrend, trend lines are drawn above the price.
- to draw a trend line in an uptrend, two lows must be connected by a straight line.
- to draw a trend line in a downtrend line, two highs must be connected by a straight line.
- a trend line should be connected by at least three highs or lows to make it valid.
- the more times the price touches the trend line, the more valid it is.
- trend lines can be used as support or resistance, in which case you can enter trades when the price touches the trend lines.
- another way to trade using trend lines is a trend line break, where the price breaks through the trend line.


